

In the first four months of 2026, 68.01% of US Google searches ended without a single click to anywhere. Ranking still matters. It simply pays out differently than it did three years ago, and the data on that shift is now good enough to plan around.
I am Neal Schaffer, and I have been running this blog since 2008. The last eighteen months have been spent working through a roughly 700-post archive, deciding what to keep, what to rewrite, and what to retire. That work is the reason I care whether a statistic is current, so every number here carries the year it was measured. A 2026 SEO decision made on a 2019 figure is a bad decision wearing a citation.
You will find what share of pages get any Google traffic at all, and which ranking factors the data actually supports. You will also find how AI summaries changed click behavior, and what your own Search Console quietly fails to tell you.
Key Takeaways
✅ 68.01% of US Google searches ended without a click in early 2026, up from 60.45% in 2024. Plan for visibility, not only for visits.
✅ 96.55% of pages get zero traffic from Google. That figure was measured in 2023, and it is the reason publishing volume was never a plan.
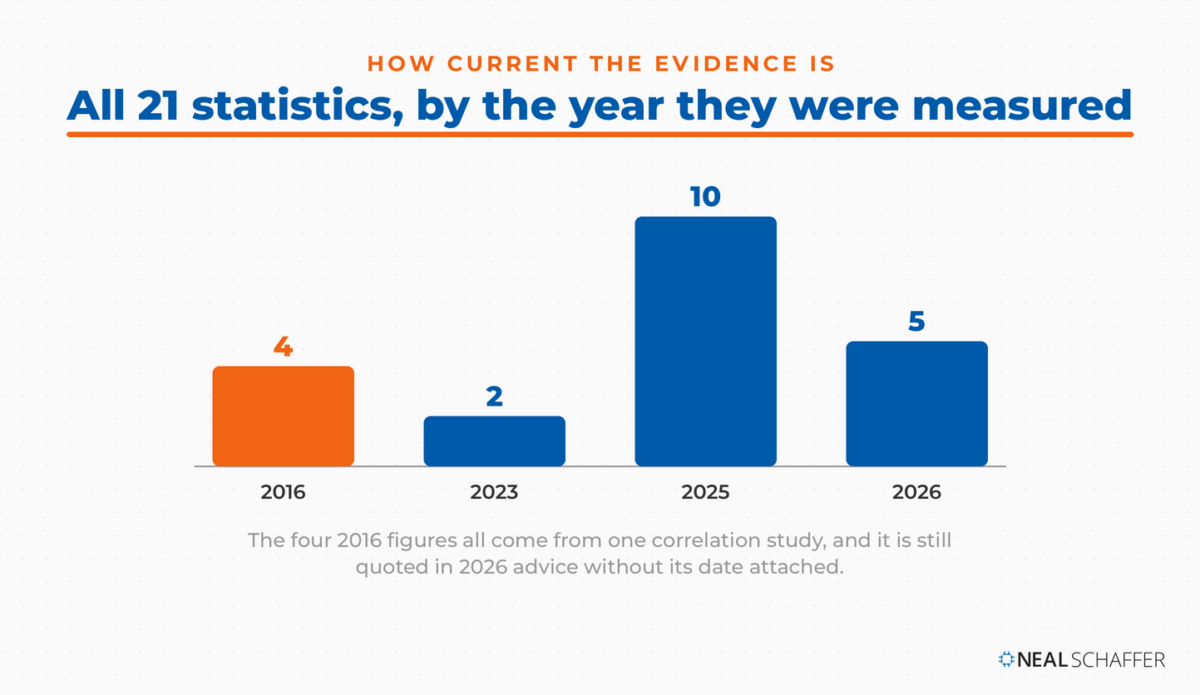
✅ One of the most-cited ranking factor studies was published in 2016. Its findings still hold up, and almost nobody quoting it says how old it is.
✅ AI summaries roughly halve the click rate on the searches where they appear, and only 1% of visits produce a click on a source cited inside the summary.
✅ Nearly half of your Search Console query data is missing. Anonymized queries made up 46.77% of traffic in the last full measurement, so page-level reporting beats query-level reporting.
How much of Google search still sends a click?
Less than a third of it. In the first four months of 2026, 68.01% of US Google searches ended without a click to any website, to Google’s own properties, or to a paid result. That share was 60.45% two years earlier. The pool of clicks reaching the open web is shrinking, and quickly.
1. 68.01% of US Google searches ended without a click in early 2026
Across January to April 2026, 68.01% of US Google searches ended without a click, per SparkToro’s analysis of Similarweb’s desktop and mobile clickstream panel. That is up from 60.45% in 2024, a rise of 7.5 percentage points. The study excludes searches made inside the Google mobile app, where SparkToro expects the zero-click rate to be higher still.
What this means for you: stop treating a ranking as a traffic guarantee and start asking what a ranking buys you when nobody clicks. That question is the one I would build an SEO strategy around in 2026, because the answer is usually brand recall and citation rather than sessions.
2. Clicks of every kind fell 9.51 percentage points between 2024 and 2026
The metric SparkToro calls “Clicks 1X+”, covering clicks on organic results, ads, and Google’s own properties, fell 9.51 percentage points between 2024 and 2026, a 22.9% decline. Over the same period the share of searches that led to another Google search rose 7.2 points. SparkToro notes the multi-year comparison stitches together three different panels, so read the direction rather than the decimal.
What this means for you: if your organic sessions are down and your rankings are not, you are probably looking at this click decline, not at a penalty. Check your positions before you rewrite anything, and if they held, the fix belongs to your SEO marketing plan rather than to the page.
3. Searches with an AI summary produced a click 8% of the time, against 15% without one
Pew Research Center tracked 68,879 Google searches made by 900 US adults in March 2025 and found that users who saw an AI summary clicked a traditional result in 8% of visits, against 15% for users who did not. Sessions also ended more often on pages carrying a summary, 26% against 16%.
What this means for you: the queries that trigger a summary are worth less in clicks and no less in influence. Sort your target terms by whether they trigger one, then spend your effort where a click is still on the table.
| Year | Share of US Google searches ending without a click |
|---|---|
| 2016 | About 45% |
| 2024 | 60.45% |
| 2026 (Jan to Apr) | 68.01% |
Source: SparkToro, “In 2026, Less than One Third of Google Searches Still Send a Click,” 2026. Figures for 2016 and 2024 come from different clickstream panels than 2026.
That is what happens after the search. The next question is how many pages were ever in contention.
How many web pages get any traffic from Google at all?
Almost none of them. Ahrefs studied around 14 billion pages in its Content Explorer index and found that 96.55% get zero traffic from Google, with another 1.94% earning between one and ten monthly visits. The study dates to December 2023 and Ahrefs names its own limits on the page, so treat the figure as a floor rather than a live reading.
4. 96.55% of indexed pages get zero traffic from Google
Ahrefs analyzed roughly 14 billion pages in December 2023 and found 96.55% of them get no traffic from Google, while 1.94% get one to ten monthly visits. Ahrefs names two limits itself. Fourteen billion is small against its 340.8 billion page index and skews toward the better end of the web. The traffic figures are also estimates, drawn from a database of about 651 million keywords.
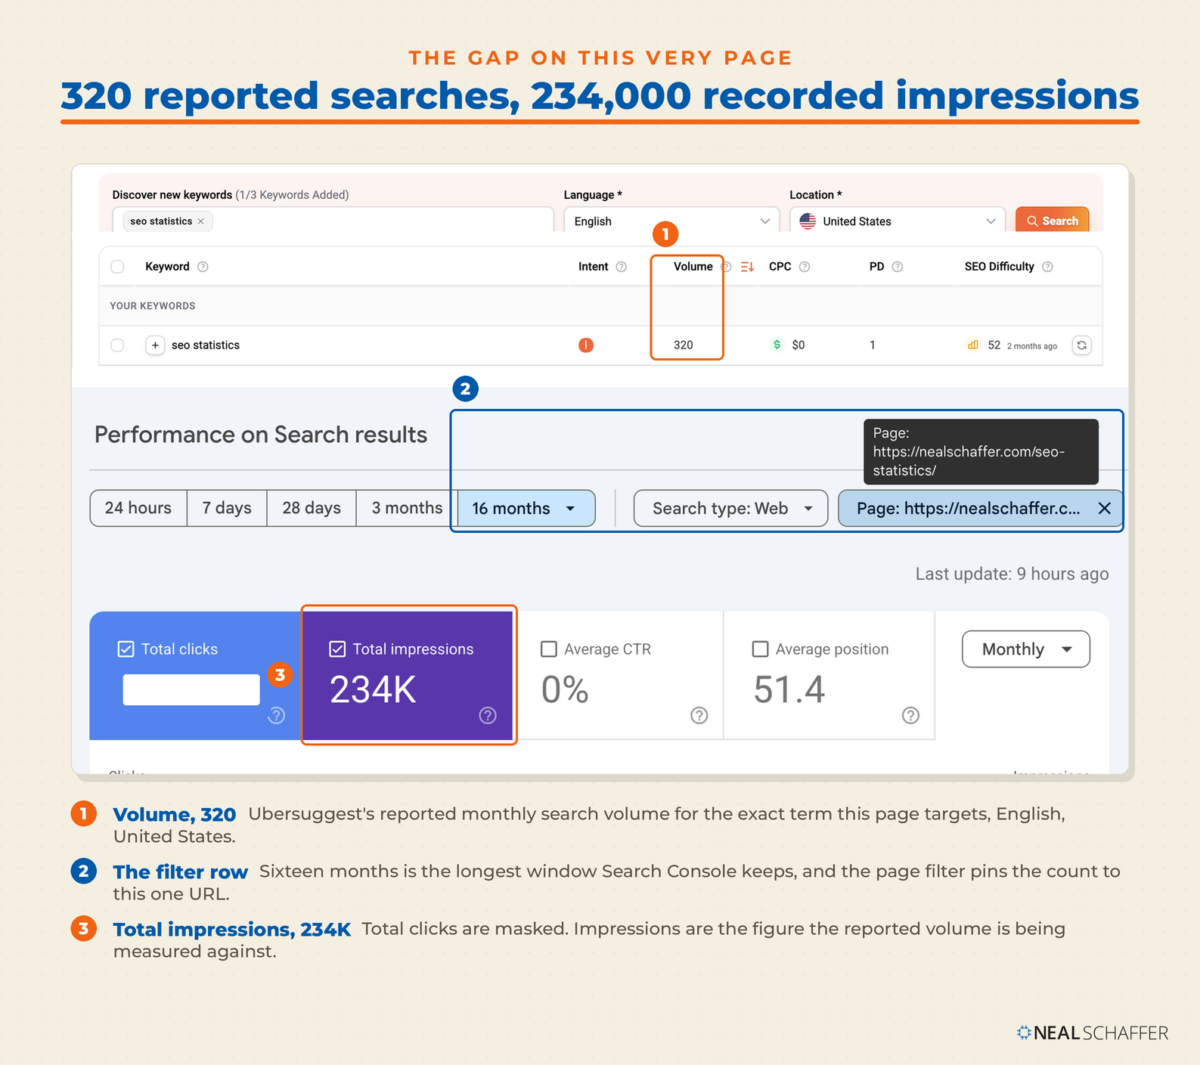
What this means for you: publishing volume is not a strategy, and it never was. Before you write anything, confirm somebody is searching for it, which is the entire job of a keyword research tool and the step most content calendars skip. Treat the reported figure as a floor, not a reading. The page you are on is a fair example: my tool reports 320 monthly searches for its target term, and Search Console recorded 234,000 impressions for the same URL over sixteen months.
5. Only 1 page in every 6,671 with no backlinks earns more than 1,000 monthly visits
Ahrefs found about 20 million pages in its index with no referring domains at all, of which just 2,997 get more than 1,000 search visits a month, roughly 1 in every 6,671. Ahrefs states plainly that correlation does not prove causation here, and points out that the unlinked pages which do earn traffic sit on high-authority domains and target low-difficulty topics.
What this means for you: you can rank without links, but only on terms nobody is fighting over. Pick those terms deliberately, and treat link building as the price of entry for anything competitive rather than as a general-purpose growth lever.
Scarce as clicks are, they still overwhelmingly come from one place.
Does Google still own search in 2026?
Yes, by a margin that has barely moved. Google held 91.1% of worldwide search referrals in August 2026, with Bing second at 4.5%. Organic search generated over a trillion visits during 2025, holding 16.04% of all measured web traffic. Google’s dominance is not in question. What it does with a search is.
6. Google held 91.1% of worldwide search market share in August 2026
StatCounter Global Stats recorded Google at 91.1% of worldwide search engine referrals in August 2026, with Bing at 4.5%, Yahoo at 1.23%, Yandex at 0.99%, DuckDuckGo at 0.7% and Baidu at 0.62%. The tracker is based on over 3 billion monthly page views and updates monthly, so the exact figure moves a little either way.
What this means for you: optimizing “for search engines” in the plural is a fiction almost everywhere. Build for Google, then check whether Bing sends you anything worth having, because on some sites it quietly does.
7. Organic search generated over a trillion visits in 2025 and grew 2.38%
Semrush analyzed billions of visits across more than 50,000 websites and 17 industries and reported that organic search generated over 1 trillion visits during 2025, holding 16.04% of all traffic and growing 2.38% year over year. Paid search grew 75.84% over the same period, from a much smaller base.
What this means for you: organic is still the biggest acquisition channel you can actually work on, and it is no longer the fastest growing one. That is an argument for keeping your SEO best practices tight while adding a second acquisition channel, not for abandoning search.
Which raises the question every client asks next: what actually moves a page up the results?
Which ranking factors do the data actually support?
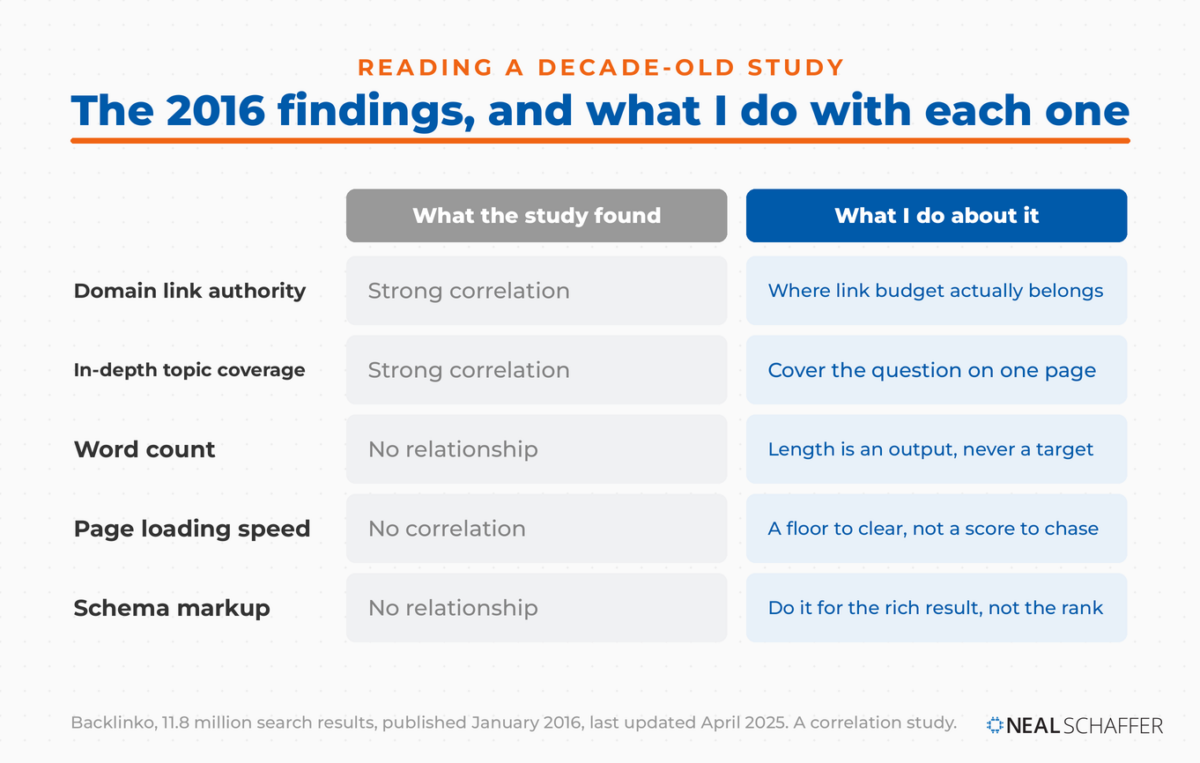
Fewer than the industry implies. A public correlation study of 11.8 million Google search results found a strong relationship for link authority, none for page speed, none for schema markup, and none for word count. It was published in January 2016 and last updated in April 2025, which is a fact almost nobody quoting it mentions.
8. The number one result has an average of 3.8x more backlinks than positions two to ten
Backlinko’s analysis of 11.8 million Google search results, published in January 2016 and last updated in April 2025, found the first result carries an average of 3.8 times more backlinks than results ranking two through ten, and three times more referring domains. Backlinko states repeatedly that this is a correlation study and cannot establish causation.
What this means for you: the figure is a decade old and still quoted constantly in link building. Use it as evidence that links matter at the top of competitive results, not as a target, and keep your own internal linking tidy since that part you fully control.
9. The average first-page result runs 1,447 words, with no relationship to position
The same 2016 study found the mean word count of a Google first-page result is 1,447 words, and that word count was evenly distributed across the top ten, meaning length showed no direct relationship with position. Long content dominates page one without long content earning the better slots on it.
What this means for you: write to the length the question needs and stop padding to a target. If your drafts run long because you are covering more ground than the results do, that is fine, and if they run long because a tool told you to, cut them.
10. First-page results load in 1.65 seconds on average, and speed showed zero correlation with rankings
Backlinko measured the median domain load time across a million domains and found the average first-page result loads in 1.65 seconds, with no correlation between speed and first-page rankings. The likely reading is that Google demotes very slow pages rather than rewarding fast ones, so the top ten are already fast enough for speed to stop separating them.
What this means for you: fix a genuinely slow site, then stop. Once your pages load in a couple of seconds, chasing a perfect score takes time from work that moves rankings. Plenty of technical SEO audits are eager to sell you that chase.
11. 72.6% of first-page results use schema markup, with no relationship to rankings
Backlinko found that 72.6% of pages on Google’s first page use schema markup and that its presence had no relationship with rankings. Google’s own current documentation makes a narrower but related point, stating that structured data is not required for generative AI search and that there is no special schema markup to add.
What this means for you: add schema for the rich results it can earn you and for machine clarity, not because you expect a ranking bump. That is a different reason to do the work, and it changes which pages deserve it first.
| Backlinko found a correlation with rankings | Backlinko found none |
|---|---|
| Domain-level link authority | Page loading speed |
| Total backlinks and referring domains | Word count |
| In-depth topic coverage | Schema markup |
| Time on site | Keyword-matched title tags |
Source: Backlinko, “We Analyzed 11.8 Million Google Search Results,” published January 2016, last updated April 2025.
Those correlations were measured on a results page that no longer looks the way it did. The AI layer changed the shape of it.
How are AI Overviews changing the numbers?
Substantially on the results page, and barely at all in referral traffic so far. Roughly one in five Google searches produced an AI summary in the last large public measurement, and longer queries produced them far more often. Traffic actually referred by AI tools remains under a fifth of one percent of web visits, even after growing 66% in a year.
12. 18% of Google searches produced an AI summary, rising to 53% for queries of ten words or more
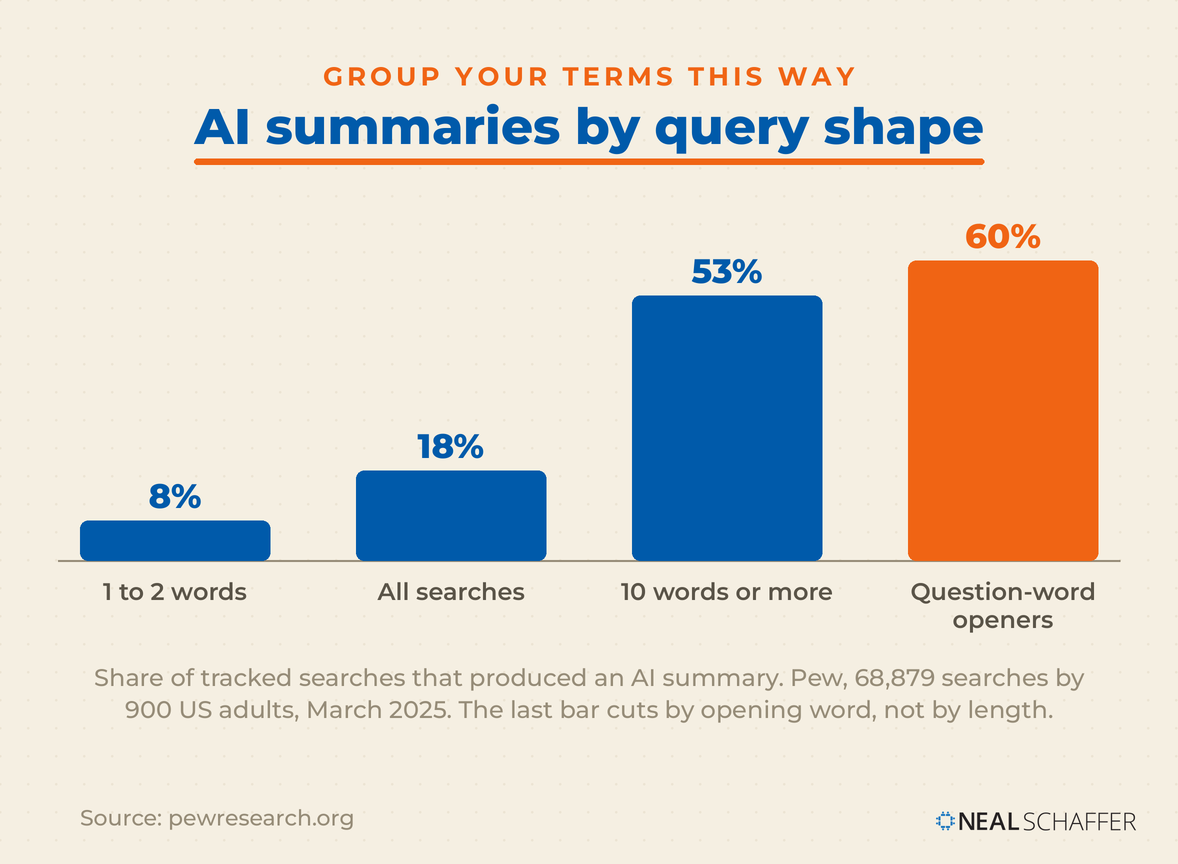
Pew Research Center found that 18% of the Google searches it tracked in March 2025 generated an AI summary, and that the rate climbed with query length: 8% for one and two-word searches against 53% for searches of ten words or more. Queries beginning with question words produced a summary 60% of the time.
What this means for you: your long conversational queries are the ones being answered on the page. Map which of your terms look like questions, because that grouping probably predicts exposure better than volume does.
13. Only 1% of visits to a page with an AI summary produced a click on a cited source
Pew found that users clicked a link inside the AI summary itself in just 1% of visits to pages carrying one. The most frequently cited sources were Wikipedia, YouTube and Reddit, which together accounted for 15% of the sources listed in the summaries examined.
Bruce Clay, the consultant many call the father of SEO, told me on my podcast that the route back to the top of the page still runs through the old work. Using AIO for AI Overviews, he put it this way: “In order to get at the top of the page, you’ve got to show up in AIO. In order to show up in AIO, you have to show up in organic.”
What this means for you: being cited inside a summary is a branding outcome, not a traffic one, and it should be measured as such. This is the whole argument behind treating answer engine optimization and generative engine optimization as visibility work rather than acquisition work.
14. AI tools sent 0.14% of web visits in 2025, after growing 66%
Semrush found that AI traffic grew 66.02% during 2025 while still accounting for under 0.15% of total web visits, rising from 462 million to 767 million monthly visits. Google AI Mode grew from 1,600 visits in January 2025 to 38.2 million in December, which is still 0.01% of all traffic.
What this means for you: size your AI investment to the referral numbers and your ambition to the visibility numbers, because those are two different scales. My own experience with AI search engine optimization is that the visits are tiny and the visitors are better than average.
15. Organic traffic declined in 13 of 17 industries during 2025
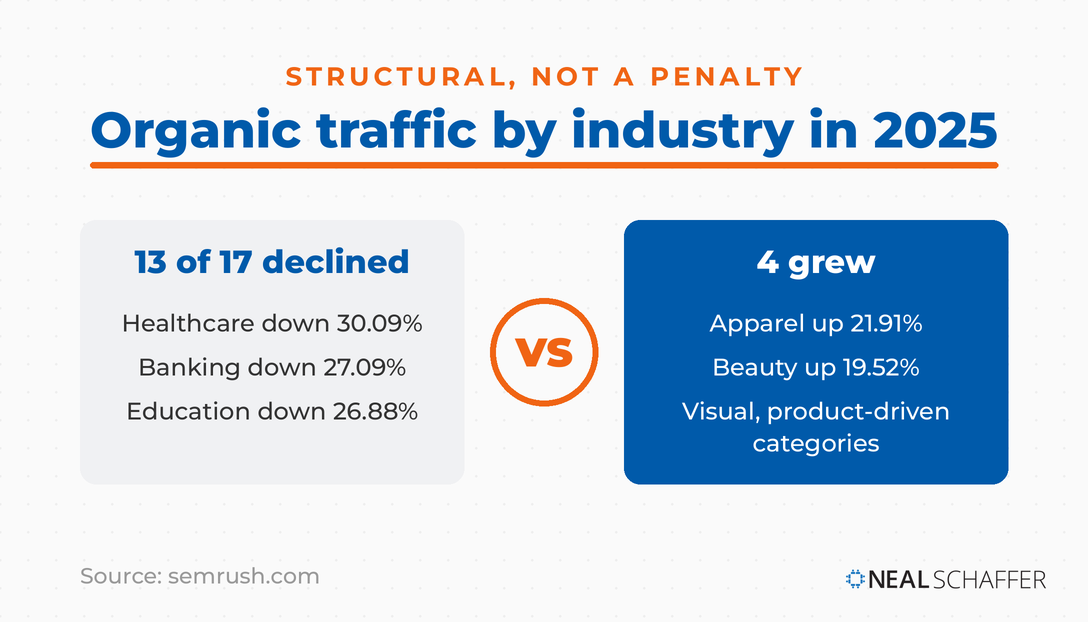
Semrush reported that organic search traffic fell in 13 of the 17 industries it tracked in 2025, with healthcare down 30.09%, banking down 27.09% and education down 26.88%. The four that grew, apparel at 21.91% and beauty at 19.52% among them, were visual, product-driven categories where people browse and compare.
What this means for you: if you sell something people want to look at before buying, search is probably still working for you. If you publish explanatory content in an advice-heavy category, assume the decline is structural and plan a second channel now.
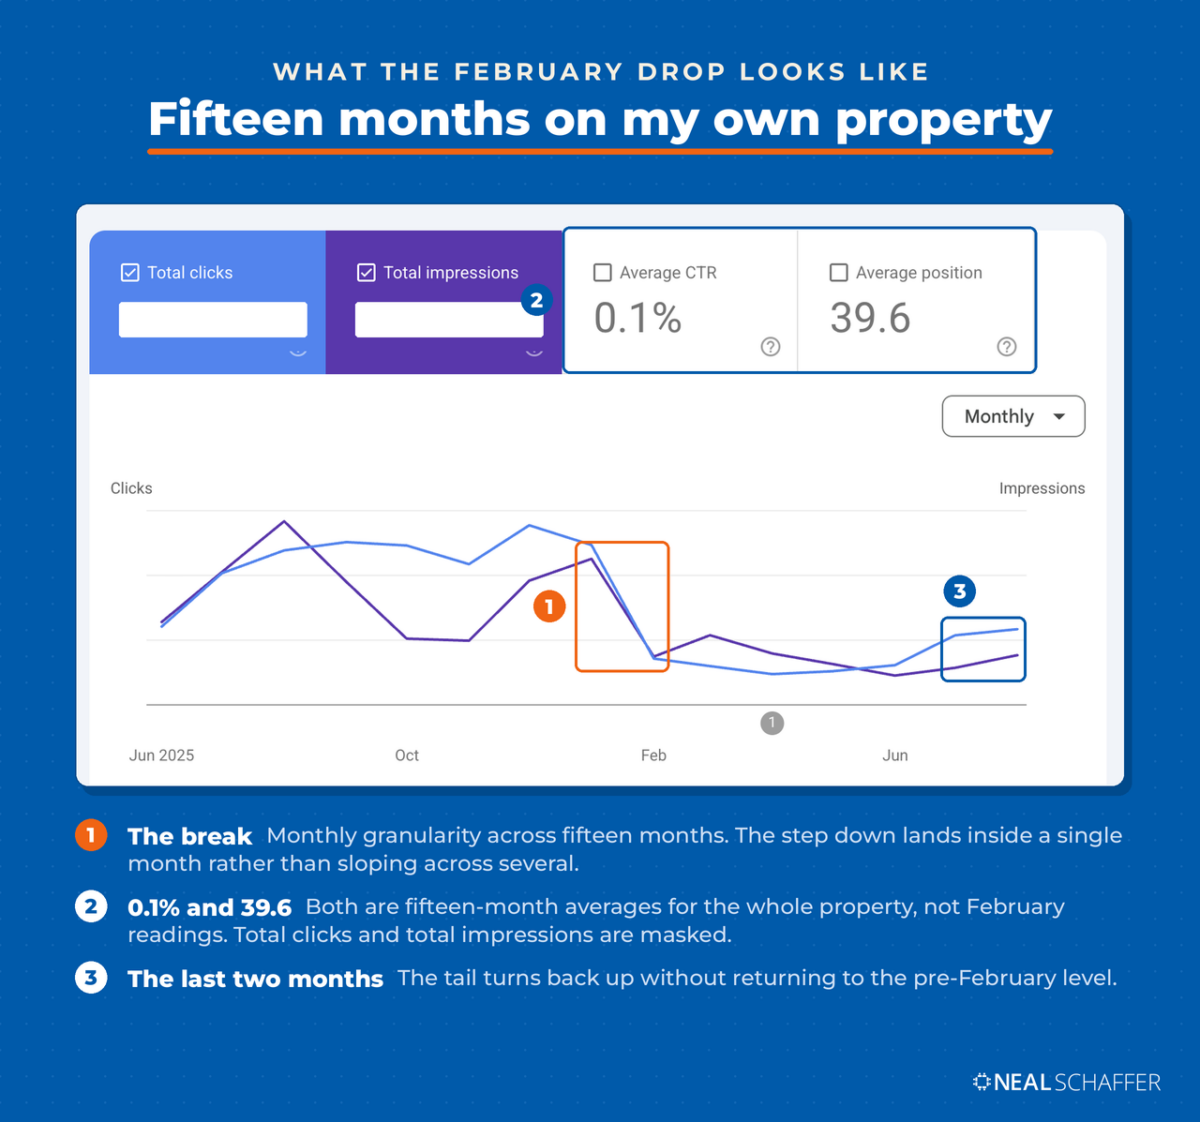
I watched a version of this on my own site. In February 2026 my organic clicks fell by roughly 71% against January. My click-through rate stayed flat at around a tenth of a percent and my average position barely moved, which points away from a ranking loss. Clicks had partly recovered by July, to something closer to half the January figure than to all of it. I could not attribute the drop to AI Overviews, to the February Discover core update, or to tracking loss.
What do the statistics say about content and blogging?
That volume stopped working and depth did not. In the most recent annual blogger survey, one marketer in five reported strong results from their blog. The average post ran 1,333 words. The share of content marketers using no AI at all fell from 65% to 5% inside two years. The people getting results are doing the uncommon things.
16. 21% of content marketers report strong results from their blog
Orbit Media’s twelfth annual blogger survey, run in August 2025 across 808 content marketers, found 21% reporting strong results from their content. Orbit uses that figure as the benchmark against which every other finding in the report is compared, and notes the sample skews toward B2B and US-based marketers in its own network.
What this means for you: four in five people doing this work are not thrilled with the outcome, which should take some pressure off. Judge your blog against 21%, not against the case studies, and read the business blogging statistics before you set next year’s targets.
17. The average blog post ran 1,333 words in 2025
Orbit Media reported the average article length at 1,333 words in 2025, down from a peak in 2023 and continuing a two-year decline. Orbit also found that marketers who prioritize longer, detailed articles are more likely to report strong results, which it calls one of the strongest correlations in the report.
What this means for you: the average is falling and the reward for beating it is not. Write fewer, longer pieces on topics you can genuinely own, and let your SEO content plan carry two deep posts a month rather than eight thin ones.
18. The share of content marketers using no AI fell from 65% to 5% in two years
Orbit Media found that the percentage of marketers who do not use AI fell from 65% to 5% over 24 months, while only about one in ten use AI to write complete articles. Among AI use cases, Orbit reports that the marketers who use it to write whole articles are the least likely to report strong results.
What this means for you: assisted drafting is now the default and full automation is still the outlier, and the data gives you no reason to join it. Use the tools for outlines, headlines and editing, then write the parts only you could have written.
Content is one half of the picture. For anyone selling to a town rather than to the internet, the other half looks different.
What do local search statistics show?
That reviews matter more each year and Google is no longer the only place people read them. In BrightLocal’s February 2026 survey of 1,002 US adults, 97% read reviews for local businesses and 41% now read them every time. Google’s share as a review source dropped 12 points in a single year while AI tools climbed into third place.
19. 97% of consumers read reviews for local businesses, and 41% read them every time
BrightLocal’s Local Consumer Review Survey 2026, fielded in February 2026 across a panel of 1,002 US adults, found 97% of consumers read reviews for local businesses and 41% now always read them when browsing, up from 29% the year before. The share who will only use a business rated 4.5 stars or higher nearly doubled, from 17% to 31%.
What this means for you: the rating bar moved under your feet in twelve months, so a profile that was acceptable last year may not clear it now. Review generation belongs in your local SEO routine as a standing task, not as a quarterly push.
20. Google’s share as a review source fell from 83% to 71% in a year
BrightLocal found that Google’s share as a source consumers use for local reviews dipped from 83% in 2025 to 71% in 2026, while use of ChatGPT and similar tools for local recommendations rose from 6% to 45%, making AI the third most popular source. Apple Maps nearly doubled, from 14% to 27%.
What this means for you: pick two platforms beyond Google where your customers actually look and build a real review presence on each. Ask which sites they checked the last time they hired someone in your category, then go where the answers point.
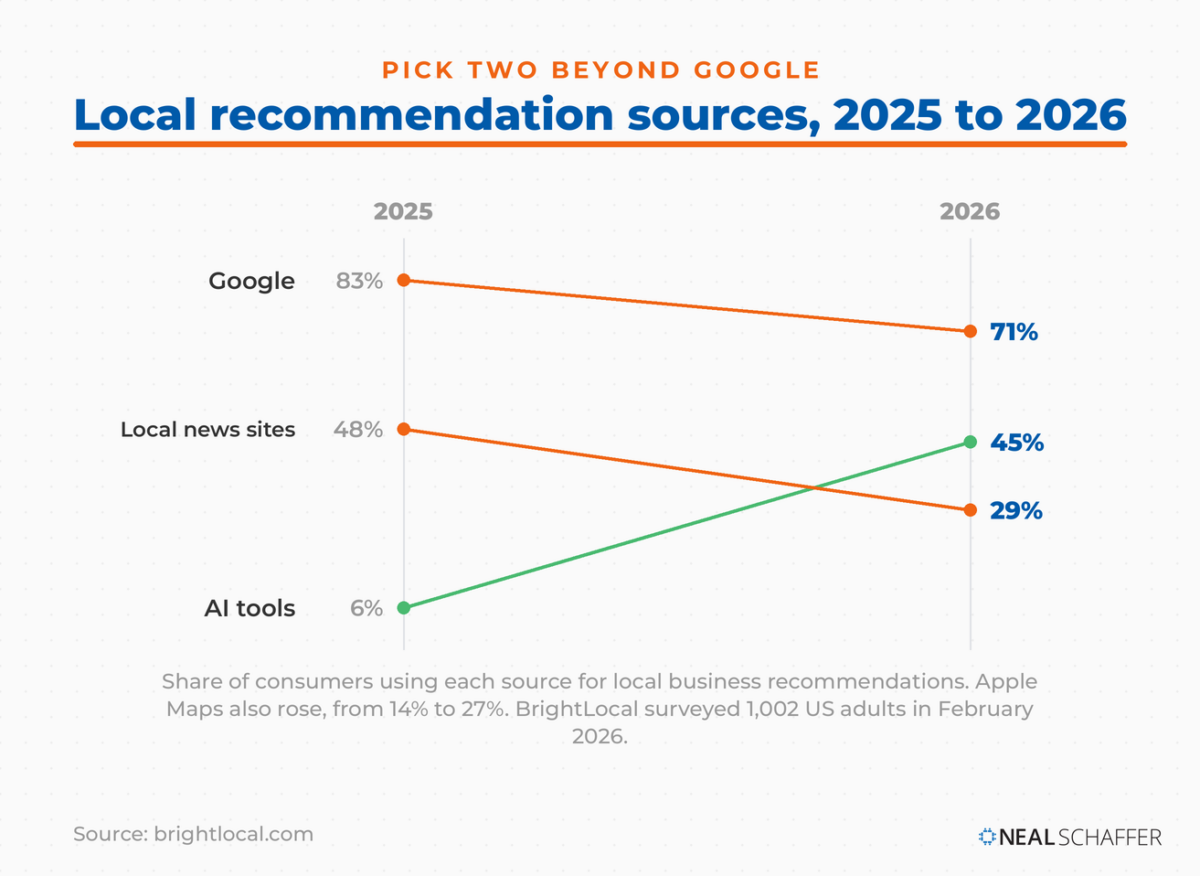
| Where consumers look for local recommendations | 2025 | 2026 |
|---|---|---|
| 83% | 71% | |
| AI tools such as ChatGPT | 6% | 45% |
| Apple Maps | 14% | 27% |
| Local news sites | 48% | 29% |
Source: BrightLocal, Local Consumer Review Survey 2026, February 2026.
All of these numbers assume you can see what is happening on your own site. That assumption deserves a closer look.
What can you actually measure in Search Console?
Roughly half of it. Anonymized queries made up 46.77% of Search Console traffic in the last full measurement, and that reading predates the AI Overviews rollout. Google withholds any query not issued by more than a few dozen users over a two-to-three month window, which on most sites takes out the long tail.
21. Anonymized queries accounted for 46.77% of Search Console traffic
Ahrefs analyzed 22 billion clicks across 887,534 Search Console properties and found anonymized queries made up 46.77% of traffic in April 2025, against 46.08% in 2022. The most common share for an individual site falls between 45% and 80%, so many sites are missing more than the average suggests. Google withholds queries not issued by more than a few dozen users over two to three months.
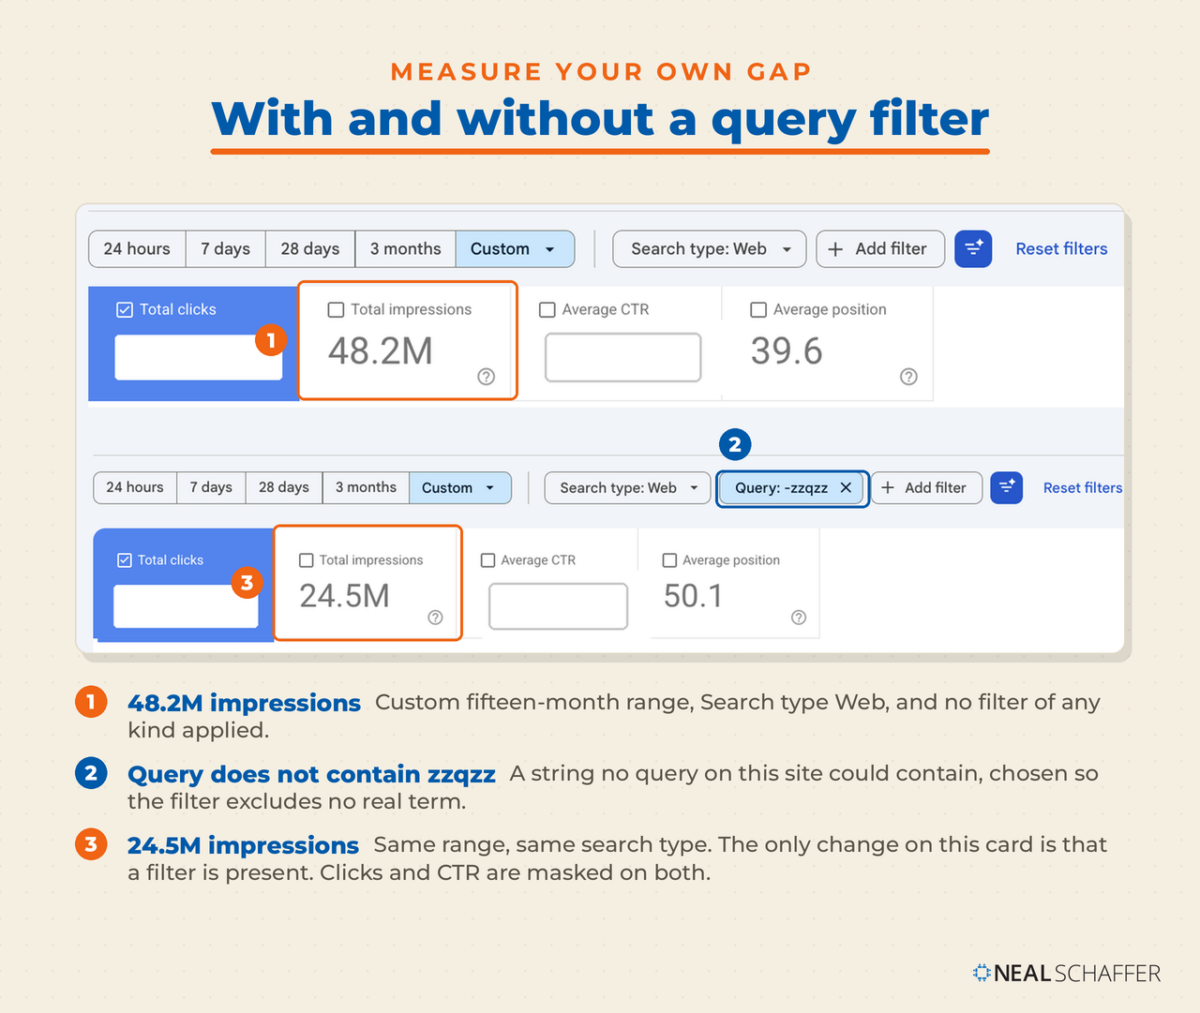
What this means for you: build your reporting on the pages tab, not the queries tab, because page totals are complete and query totals are not. You can measure your own gap in about a minute. Note your total, then add a query filter that excludes nothing, Query, Queries not containing, and any string your site would never rank for. The total drops by however much Google is withholding. On my property, over fifteen months, roughly half the impressions vanished. When I check whether a rewrite worked, I compare page-level impressions and position first, and only then go looking at the terms.
Frequently Asked Questions About SEO Statistics
68.01% of US Google searches ended without a click in the first four months of 2026, measured on Similarweb’s clickstream panel. That covers clicks of every type, including to Google’s own properties and to paid results, so under a third of searches now send a visit anywhere.
It has no traceable primary source. The figure circulates constantly and is attributed to several different organizations depending on who is quoting it, none of which published a study containing it. If it is sitting in your deck, cut it.
96.55%, based on Ahrefs’ 2023 study of around 14 billion pages, with a further 1.94% earning between one and ten visits a month. The figure is three years old, and Ahrefs states on the page that its sample skews toward the better end of the web.
Pew measured a wide gap: an 8% click rate on searches with an AI summary against 15% without one, and only 1% of those visits produced a click on a source cited inside the summary. Pew reports an association rather than proof that the summaries caused it.
Because anonymized queries are included in your chart totals but omitted from the query table. They accounted for 46.77% of traffic in the last full measurement, which is why summing your query rows produces a smaller number than the chart above them.
Put These SEO Statistics to Work
Take three numbers from this page into your next planning session and leave the rest. Start with the 68.01% zero-click figure, because it decides whether traffic is still a fair way to judge your search work at all.
Then take the 96.55% zero-traffic figure and use it as a filter on your publishing calendar. Confirm demand before you commit a writer, every time.
Last, take the 46.77% anonymized-query figure and move your reporting to the page level, so you stop making decisions on half a dataset.
I made this case on my podcast years ago and I still run my own blog that way. I review anything that still earns traffic at least once a year, and I rewrite a post outright once the underlying facts have moved. That is the whole method, and it has carried my site through eighteen months of rebuilding.
If you want the same treatment applied across your channels rather than one page at a time, my fractional CMO services exist for exactly that. If you would rather do it yourself, download a free preview of Digital Threads, where search is one of the three threads I build the framework around. And when you need the numbers for the layer above search, the content marketing statistics are the companion set to this one.

Improve Your SEO Through Guest Blogging
We respect your privacy. Unsubscribe at anytime.
