
As a Fractional CMO and someone who has worked with brands of all shapes and sizes, I know firsthand that obsessing over traffic without obsessing over conversions is a recipe for waste. Yet for many ecommerce businesses, the conversion rate remains a misunderstood metric.
What counts as a “good” ecommerce conversion rate in 2026? How do you interpret yours in the context of your industry, product price point, and customer journey?
Think about it: You could drive 100,000 visitors to your store, but if only 1% convert, you’re leaving massive money on the table. Meanwhile, your competitor with half the traffic and a 4% conversion rate is running circles around you.
As the author of Digital Threads, my modern digital marketing playbook, and host of the Your Digital Marketing Coach podcast, I’ve helped ecommerce brands transform their conversion strategies. In this article, I’ll help you cut through the noise. You’ll find real-world benchmarks, overlooked metrics that matter more than you think, and strategic guidance to not just chase averages but beat them.
Key Takeaways
✅ The global average ecommerce conversion rate is 2.5-3%, but top performers achieve 4-5% or higher
✅ Industry matters significantly: food and beverage converts at over 6%, while luxury goods hover around 1%
✅ Desktop still outperforms mobile (3.9% vs 1.8-2.9%), but the gap is narrowing with improved mobile optimization
✅ Cart abandonment averages 70%, with extra costs being the number one reason shoppers leave
✅ Focus on profitability per visitor, not just conversion volume
✅ Testing, trust signals, and friction removal drive sustainable conversion gains
What Is an Ecommerce Conversion Rate?
An ecommerce conversion rate is the percentage of website visitors who complete a purchase. Calculate it by dividing total transactions by total visitors, then multiplying by 100. For example, 50 purchases from 2,000 visitors equals a 2.5% conversion rate.
Before you can improve your ecommerce conversion rate, you need to understand exactly what you’re measuring. Let’s break it down.
How Do You Calculate Ecommerce Conversion Rate?
The formula is straightforward:
Ecommerce Conversion Rate = (Total Conversions ÷ Total Visitors) × 100
Here’s the nuance most people miss: conversion rates are typically measured by sessions, not unique users. According to Google Analytics documentation, ecommerce conversion rate is defined as “the ratio of transactions to sessions, expressed as a percentage.”
This means your rate reflects how often purchases happen within a given timeframe, not necessarily how many individual customers are buying.
Why does this matter? A returning customer who visits three times before purchasing counts as three sessions but one conversion. Understanding this distinction helps you interpret your data more accurately.
What Types of Ecommerce Conversions Should You Track?
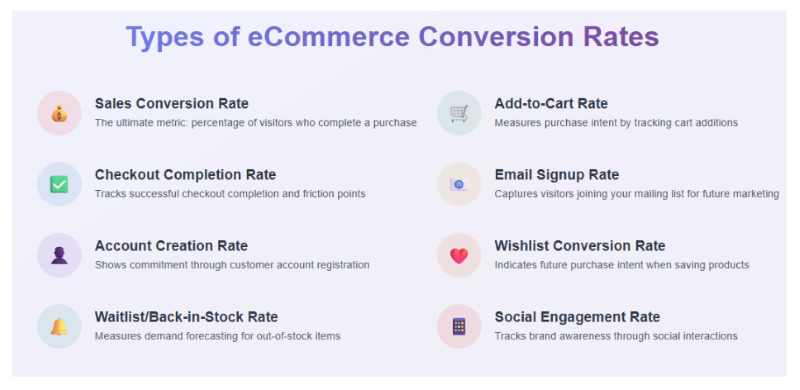
While completed purchases are the primary metric, smart marketers track the entire customer journey. Here are the micro-conversions that signal buying intent:
| Conversion Type | What It Indicates | Why It Matters |
|---|---|---|
| Add to Cart | Strong purchase intent | Shows your product pages are working |
| Wishlist Add | Future purchase intent | Indicates interest for retargeting |
| Email Sign-up | Brand trust | Builds your owned audience |
| Lead Magnet Download | Engaged prospect | Validates your content marketing strategy |
| Account Creation | Committed interest | Reduces future checkout friction |
By tracking each conversion type, you identify exactly where your ecommerce marketing strategy is succeeding and where it needs work. I’ve seen brands discover their product pages were stellar, but their checkout process was hemorrhaging customers.
What’s Considered a Good Ecommerce Conversion Rate in 2026?
A good ecommerce conversion rate today falls between 2.5% and 3% globally. However, top-performing stores can achieve 4-5% or higher. What counts as “good” depends entirely on your industry, traffic sources, and product price points.
Overwhelmed by Digital Marketing?
Just released: my new book to help small businesses, entrepreneurs, and marketers master digital marketing in today’s digital-first world.
Drawing on my Fractional CMO experience, Digital Threads simplifies complex strategies into clear, actionable steps for success.
Transform your business today—grab your copy! Click the cover or button below to buy on Amazon.

Here’s the honest truth: there’s no single answer. Context is everything.
According to IRP Commerce data, the all-industry average ecommerce conversion rate sits at approximately 1.89%, though Shopify’s research indicates their established merchants typically see 2.5-3% rates.
What Are the Average Conversion Rates by Industry?
Industry benchmarks vary dramatically. Here’s a range of what you’re up against:
| Industry | Average Conversion Rate |
|---|---|
| Food & Beverage | 5.5–6.1% |
| Personal Care & Beauty | 4.5–6.8% |
| Pet Care | 2.3–3.2% |
| Fashion & Apparel | 1.7–3.0% |
| Consumer Electronics | 1.4–2.4% |
| Home & Furniture | 1.4–1.5% |
| Luxury & Jewelry | 0.9–1.2% |
Why does food and beverage crush it while luxury lags? Necessity and price point. People need to eat, and a $30 grocery order requires less deliberation than a $3,000 watch. According to Red Stag Fulfillment’s analysis, “Industry conversion rates correlate inversely with average order value.” If you’re in luxury goods and hitting 1.5%, you’re actually outperforming your peers.
How Do Conversion Rates Differ by Device?
Desktop still wins, but mobile is catching up. According to Blend Commerce’s benchmarks, desktop sessions convert at roughly 3.9% compared to 1.8% on mobile.
| Device | Average Conversion Rate |
|---|---|
| Desktop | 3.2–3.9% |
| Tablet | 2.1–3.5% |
| Mobile | 1.8–2.9% |
Here’s what’s interesting: mobile accounts for over 70% of ecommerce traffic but converts at lower rates. This gap represents a massive opportunity. If your mobile experience is clunky, you’re leaving serious revenue on the table.
According to Skailama’s research, a good mobile ecommerce conversion rate in 2025-2026 ranges between 2.5% and 3%, with anything above 5% considered excellent.
I’ve blogged extensively about ecommerce analytics, and device-level conversion tracking should be non-negotiable for any serious ecommerce operation.
What Conversion Rates Can You Expect by Traffic Channel?
Not all traffic is created equal. Here’s what the data shows:
| Traffic Source | Average Conversion Rate |
|---|---|
| Email Marketing | 4.0–10.3% |
| Direct Traffic | 3.0–5.0% |
| Organic Search | 2.5–3.5% |
| Paid Search | 2.5–3.2% |
| Referral | 2.0–3.0% |
| Social Media | 1.0–2.5% |
Notice how email marketing dominates? According to ConvertCart’s analysis, email marketing has an average conversion rate of around 8-10% thanks to its highly segmented and personalized nature, with an ROI of $36-40 for every dollar spent.
That’s because email subscribers already know and trust you. If you’re not prioritizing your email list, start now. Check out my guide on ecommerce email marketing for strategies that work.
Social media traffic often converts lower because the intent is different. People scroll to discover, not necessarily to buy. That doesn’t mean social is worthless; it’s just a different part of the funnel.
Why Don’t Averages Tell the Full Story?
I can’t stress this enough: averages are directional, not definitive. Here’s why your “below average” conversion rate might actually be fine:
- High-ticket products naturally convert lower (often below 1.5%)
- First-time visitors behave differently than returning customers
- Your pricing model affects buying behavior
- Customer lifetime value may compensate for lower initial conversions
If you’re selling $5,000 luxury furniture with a 0.8% conversion rate and strong CLV, you’re probably doing great. Stop comparing yourself to someone selling $25 t-shirts.
“The idea of a universal benchmark for ecommerce conversion rates is a fallacy. A conversion rate isn’t just driven by the quality of the store’s experience, and a higher rate isn’t always better.” — Shopify
What Metrics Beyond Conversion Rate Drive Real Growth?
Focusing solely on conversion rate leads to short-sighted decisions. A complete picture of store performance requires tracking cart abandonment, average order value, and customer lifetime value alongside your conversion rate.
Here are the metrics that actually move the needle when you’re tracking ecommerce KPIs.
What Are the 7 Essential Ecommerce Metrics to Monitor?
| Metric | What It Measures | Why It Matters |
|---|---|---|
| Cart Abandonment Rate | % who add to cart but don’t buy | Identifies checkout friction |
| Bounce Rate | % who leave after one page | Shows content/targeting issues |
| Average Session Duration | Time spent on site | Indicates engagement quality |
| Average Order Value (AOV) | Revenue per transaction | Impacts profitability directly |
| Average Basket Size | Items per order | Shows cross-sell effectiveness |
| Returning Customer Rate | % of repeat buyers | Measures loyalty and satisfaction |
| Customer Lifetime Value (CLV) | Total expected revenue per customer | The metric that matters most |
Let me share something from my experience: I’ve seen brands obsess over conversion rate while ignoring AOV. They optimized for more transactions but accidentally decreased profitability. A 3% conversion rate with a $150 AOV beats a 4% conversion rate with a $75 AOV every time.
What Is the Average Cart Abandonment Rate?
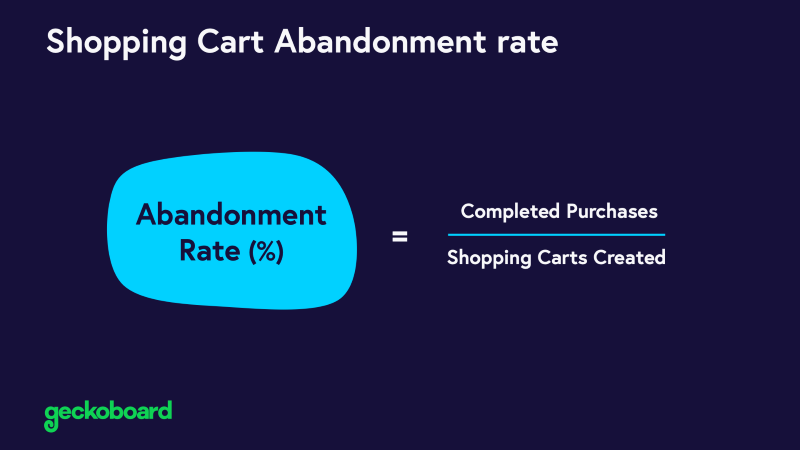
According to Baymard Institute’s meta-analysis of 50 different studies, the average cart abandonment rate is 70.22%. That means roughly 7 out of 10 shoppers who add items to their cart leave without buying.
The primary reasons shoppers abandon their carts:
| Reason for Abandonment | Percentage |
|---|---|
| Extra costs too high (shipping, taxes, fees) | 47-48% |
| Site wanted customer to create an account | 19-25% |
| Delivery too slow | 21-24% |
| Didn’t trust site with credit card | 18% |
| Checkout too long or complicated | 17-22% |
| No preferred payment method | 13% |
Look at that first reason. Nearly half of abandonments happen because of surprise costs. This is fixable. Be transparent about shipping upfront; it’s that simple.
According to Baymard’s checkout research, the average large-sized ecommerce site can gain a 35.26% increase in conversion rate through better checkout design alone.
How Does Conversion Rate Connect to Business Strategy?
Here’s the mindset shift you need: profitability per visitor matters more than conversion rate alone.
Consider this scenario:
- Store A: 4% conversion rate, $50 AOV, $2 profit per visitor
- Store B: 2% conversion rate, $200 AOV, $4 profit per visitor
Store B is winning despite the “worse” conversion rate. This is why you need to understand your marketing ROI holistically. When building your ecommerce business, your digital marketing strategy should tie conversion optimization to CLV, customer acquisition cost, and overall profitability, not just chase a vanity metric.
How Do You Improve Your Ecommerce Conversion Rate?
Improving conversion rates requires reducing checkout friction, building trust through social proof and transparency, and using personalization to match offers to buyer intent. Most gains come from removing obstacles, not adding features.
Let’s get tactical.
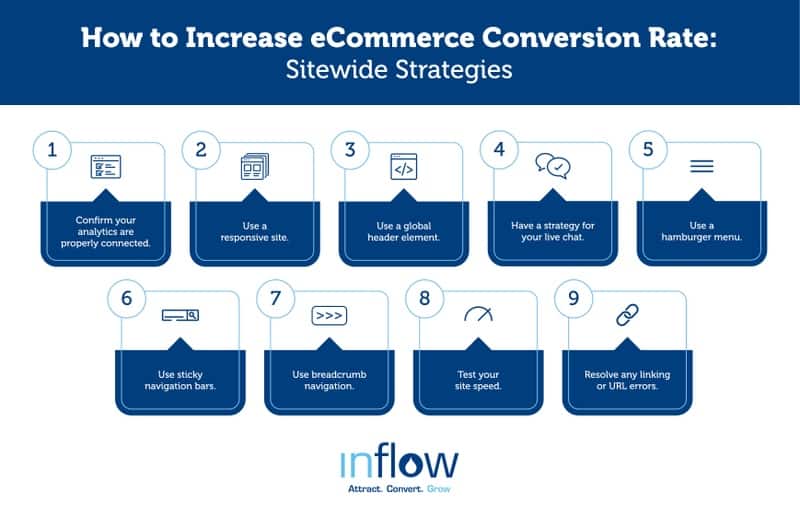
How Do You Remove Friction from the Buying Experience?
Here’s your friction-removal checklist:
Checkout Optimization:
Site Speed:
- Pages should load in under 3 seconds (use Google PageSpeed Insights to test)
- According to Loyally.ai’s research, if your site loads one second quicker, your conversion rate can increase by 17%
- Compress images without sacrificing quality
- Consider a CDN for faster global delivery
Price Transparency:
- Show shipping costs early, ideally on the product page
- Display all fees before checkout
- Offer free shipping thresholds (and make them prominent)
Mobile Experience:
- Design mobile-first, not mobile-adapted
- Ensure buttons are thumb-friendly
- Simplify navigation for smaller screens
I’ve written about the importance of SEO for ecommerce and site performance, and these same principles apply to conversion. Fast, user-friendly sites win.
How Do You Build Trust and Reduce Purchase Anxiety?
TTrust is the invisible force behind every conversion. Here’s how to earn it:
Transparency:
- Display clear return and refund policies (link them prominently)
- Show real contact information
- Be upfront about shipping times
Social Proof:
- Feature customer testimonials prominently
- Display product reviews near buy buttons
- Show user-generated content (UGC marketing is powerful)
- Include trust badges and security seals
Payment Security:
- Display SSL certificates
- Offer familiar payment options (PayPal, Apple Pay, etc.)
- Show accepted card logos
According to Baymard’s research, 18% of cart abandonment stems from credit card trust issues. A few security badges can directly impact your bottom line.
How Can Personalization Drive More Conversions?
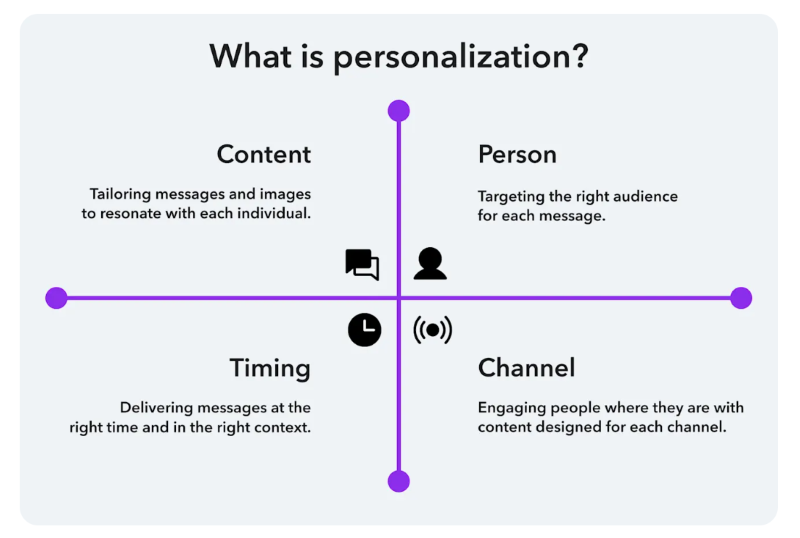
GGeneric experiences get generic results. Personalization shows you understand your customer.
Behavioral Triggers:
- Recommend products based on browsing history
- Show “recently viewed” items
- Suggest complementary products at checkout
Urgency and Scarcity:
- Display low-stock warnings (when genuine)
- Use time-limited offers strategically
- Show how many people are viewing an item
Email Retargeting:
- Send abandoned cart emails (recovers 5-10% of lost sales)
- Personalize subject lines with product names
- Include product images and a direct link back
The benefits of AI in ecommerce include sophisticated personalization at scale. Tools now exist that make this accessible to businesses of any size.
What Advanced Strategies Separate Top Performers?
Once fundamentals are in place, advanced tactics like systematic A/B testing, segmented customer journeys, and high-ticket sales optimization create sustainable competitive advantages.
How Should You Approach A/B Testing?
Don’t guess. Test. But test strategically.
What to Test:
- Headlines and value propositions
- CTA button text, color, and placement
- Product image layouts
- Pricing display (monthly vs. annual)
- Form length and field order
Testing Best Practices:
- Start with high-impact elements (headlines, CTAs)
- Run tests long enough for statistical significance
- According to Red Stag Fulfillment, you need at least 1,000 conversions per test variant to reach statistical significance
- Test one variable at a time
- Document everything and build institutional knowledge
The companies winning at ecommerce treat testing as a continuous process, not a one-time project.
How Do You Optimize for High-Ticket Sales?
High-ticket products require different tactics:
| Low-Ticket Tactics | High-Ticket Tactics |
|---|---|
| Quick checkout | Extended consideration content |
| Urgency-driven CTAs | Trust-building content |
| Simple product pages | Detailed specifications + video |
| Self-service | Live chat with experts |
| One-time purchase focus | Financing options |
For expensive items, consider:
- Video demonstrations and virtual tours
- Live chat support during business hours
- Comparison guides against competitors
- Financing/payment plan options
- Extended warranty information
The trust gap is larger for high-ticket purchases. Your content needs to close that gap before the conversion can happen. Check out ecommerce photography tips for making products shine.
What Analytics Tools Should You Use?
The right ecommerce tools make data actionable:
I recommend starting with Google Analytics 4 and a heatmap tool. These two alone reveal 80% of what you need to know.
The Neal Schaffer CRO Framework for Strategic Growth
After years of working with ecommerce brands, here’s my tried-and-true approach:
- Audit traffic quality — Not all visitors are equal. Analyze by source and intent.
- Diagnose funnel leaks — Use segmented KPIs to find where customers drop off.
- Review message-market match — Is your landing page copy aligned with ad promises?
- Implement hypothesis-driven testing — Test based on data insights, not random guesses.
- Tie everything to business KPIs — Revenue, customer acquisition cost, and CLV matter most.
This framework has helped clients across industries, from Shopify SEO optimization to Amazon marketing strategies. The principles remain constant.
What Conversion Rate Optimization Mistakes Should You Avoid?
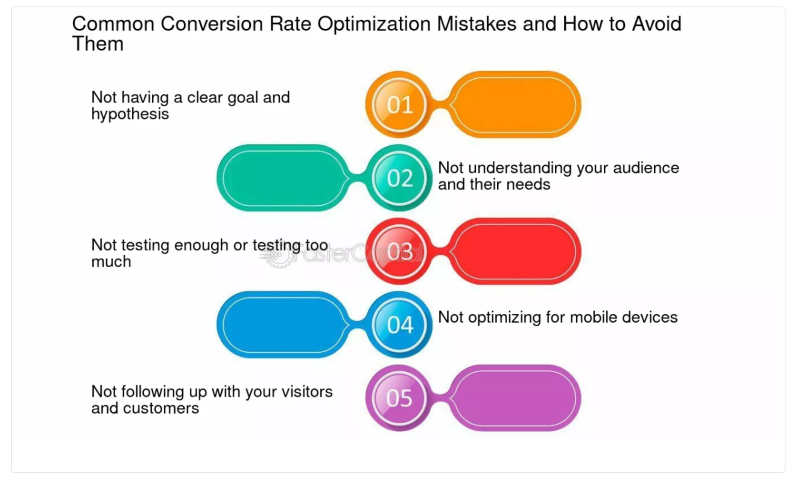
Even smart marketers make these errors:
Copying Competitors Blindly: What works for them may not work for your audience. Their customers aren’t your customers.
Obsessing Over Button Colors: Spend your energy on messaging and offer clarity, not whether your CTA should be orange or green.
Ignoring Mobile: If 60%+ of your traffic is mobile and your mobile experience is mediocre, nothing else matters.
Forgetting Emotional Friction: Purchase decisions aren’t purely rational. Address fears, uncertainties, and doubts directly.
Optimizing for Conversion Rate Alone: A 5% conversion rate means nothing if you’re attracting low-value customers who never return.
When choosing between platforms like Shopify or WooCommerce, consider which gives you better conversion optimization capabilities for your specific needs.
Frequently Asked Questions About Ecommerce Conversion Rates
A good ecommerce conversion rate in 2026 ranges from 2.5% to 3.2%, with top-performing stores achieving 4-5% or higher. However, this varies significantly by industry. Food and beverage brands typically see 5-6%, while luxury goods convert at 1-1.5%. Compare your rate against your specific industry benchmark rather than overall averages.
Low conversion rates despite high traffic usually indicate a mismatch between your audience and offer. Common causes include poor mobile experience, unclear value propositions, hidden shipping costs, complicated checkout processes, or attracting the wrong traffic through misaligned ads. Start by analyzing your funnel to identify the exact drop-off point.
According to Baymard Institute’s research, the average large ecommerce site can gain up to 35% improvement in conversion rate through checkout design improvements alone. Simple fixes like offering guest checkout, reducing form fields, and showing all costs upfront can recover significant lost revenue.
Yes, mobile apps convert approximately 3x higher than mobile websites. Apps provide faster loading, better user experience, push notification capabilities, and stored payment information that reduces checkout friction. If mobile traffic is significant for your business, an app may be worth the investment.
Conversion optimization should be an ongoing process, not a one-time project. Run continuous A/B tests on high-impact elements like headlines, CTAs, and checkout flows. Most businesses benefit from having at least one test running at all times, with results reviewed monthly. Prioritize tests based on potential revenue impact and traffic volume.
Ready to Transform Your Ecommerce Conversion Rate?
Your ecommerce conversion rate is a mirror reflecting how well your business understands its audience, value proposition, and digital experience.
Here’s my challenge to you: Stop chasing generic benchmarks. Start creating experiences that convert your unique traffic into loyal, repeat customers.
Whether you’re selling luxury goods or consumer products, conversion optimization is never “done.” It’s an ongoing process that bridges analytics, empathy, and action.
Focus on:
- Understanding your specific audience deeply
- Removing every unnecessary friction point
- Building trust at every touchpoint
- Testing continuously and learning constantly
- Measuring success holistically, not just by conversion rate
That’s how you win in ecommerce. And that’s how you position your brand for long-term, profitable growth.
Ready to take your ecommerce marketing to the next level? Start by auditing your current conversion rate by device and channel. The insights might surprise you. For strategic guidance, explore my Digital First Group Coaching Community or download my free Marketing Tools Guide to identify the right tools for your conversion optimization stack. And if you need hands-on strategic help, don’t hesitate to reach out.
Actionable advice for your digital / content / influencer / social media marketing.
Join 13,000+ smart professionals who subscribe to my regular updates.